
Contents
Apache Ossie shows where your metrics are defined

Category: Data Engineering | Tags: #apache ossie, #open semantic interchange, #semantic layer, #power bi, #data catalogue, #ontology
We tried the open standard on an example with delayed flight departures. It gives a good map of the definitions you already have, but there is a long way to go before metrics can be moved safely between tools.
This article builds on our internal day on 7 October, where we went through the specification and tried the converter for Power BI.
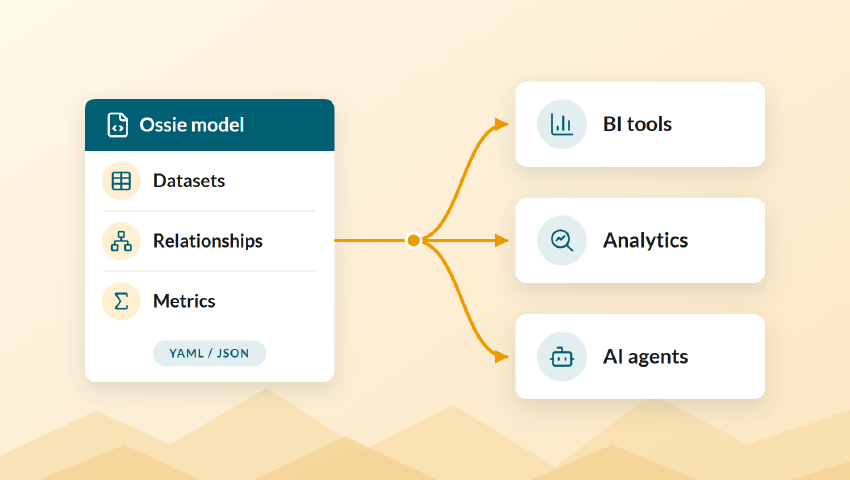
In short: Apache Ossie, formerly Open Semantic Interchange (OSI), is an open standard for describing datasets, concepts and metrics in YAML, so that the definitions can be moved between BI tools, data platforms and AI agents. The standard calculates nothing itself, and the expressions cannot always be translated between tools. Today it is most useful as a map of the definitions you already have, and as a basis for clean-up and migration.
How delayed are the departures on a flight route on average? Ask three tools, and you may get three answers. One counts cancelled departures as zero minutes late, one leaves them out, and one averages per day before averaging for the whole month. All three formulas look right, and none of the tools reports an error.
At most of the organisations we work with, the same goes for active customer, revenue and delivery rate. The metrics are defined in Power BI, in dbt, in a spreadsheet in finance and now also in the instructions to an AI agent. The project behind Apache Ossie uses monthly active users as its example. The term is defined differently in the CRM, the data warehouse and the BI tool, and neither an analyst nor an agent should have to guess which definition applies.
Ossie is meant to solve this. Snowflake started the work in September 2025 under the name Open Semantic Interchange, together with Salesforce, dbt Labs, BlackRock and RelationalAI, among others. In June this year the project was accepted into the Apache Incubator and got a new name. The standard is an open format for describing datasets, fields, relationships and metrics, so that the definitions can be moved between tools instead of being locked into one.
At our internal day on 7 October we sat down with the specification and the flight example that comes with it on GitHub, to see what the standard does with the problem above. The room agreed that the use case is clear, but that there is a long way to go before the standard works in practice. Today Ossie is most useful as a map of the definitions you already have, not as a shared engine that makes all the tools calculate the same way.
What is Apache Ossie?
Apache Ossie is an open specification for semantic layers and ontologies. It describes business concepts, metrics, dimensions and the relationships between them in a format no vendor owns, and that BI tools, query engines and AI agents can read and write. The project is in the Apache Incubator, and the specification is still a draft.
The announcement on the project website justifies the choice of Apache by saying that a standard for the whole industry cannot be controlled by one player. During incubation, changes to the specification are voted on in open channels, and the right to change the code is earned through contributions, not through your employer. According to the project, more than 50 organisations have joined, compared with 17 at launch. Contributors from Snowflake, Databricks, dbt Labs, Salesforce, Dremio and GoodData, among others, have delivered more than 100 commits. dbt Labs made its metrics engine MetricFlow open source in October 2025, citing the work on Ossie as the reason.
The breadth is real, but the maturity is low. The specification is at version 0.2.0.dev0 and itself says it should not be used in production, and the latest released version is 0.1.1 from December 2025. Anyone adopting the standard now must expect the format to change.
The flight example through four layers
The flight example in the repo shows how Ossie is meant to be used, in four layers: an ontology with the concepts, a semantic model with the datasets, a mapping that links the two, and the tables in the database. The first three are separate files, and the example shows that the standard is more than a schema for metrics.
The ontology describes what exists in the business: twelve kinds of things, such as Flight, Carrier, Aircraft, Airport and Route, and 32 value types, such as minutes, miles and the codes that identify an airline. It also holds the relationships and how many of each there can be, for example that an airline has exactly one code, and that a route has one departure airport and one arrival airport. One person in the group called the ontology “catalogue food”. It contains the concepts and not a word about tables.
The semantic model describes what is in the database: six datasets with 51 fields in total, one dataset per table. The mapping links the two, and says for example that the airline’s code is read from the column code in the table CARRIER. Because the concepts do not know about the columns, the same ontology can be linked to a different database. The separation between the concepts and the tables, and the link between them, also decides whether an AI agent understands what the data means. We have written about that in Metadata and ontology have become the foundation AI reads from.
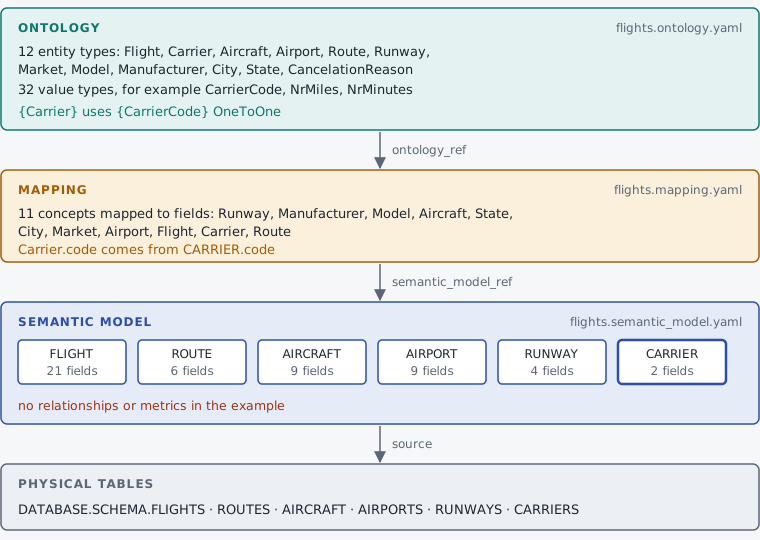
Notice what is missing. The semantic model in the example has no relationships and no metrics, only datasets and fields. The specification has room for both, and for the field ai_context with synonyms and example questions for agents, but the flight example does not use them. The meaning lives in the ontology.
Where is the metric calculated?
Ossie calculates nothing itself. The standard says where the definition of a metric lives and which language the expression is written in, and the tool that uses the model does the calculation. A metric is an aggregation expression, such as a sum or an average, written in an expression language that is a restricted subset of ANSI SQL.
The expression language is called OSSIE_SQL_2026 and does not allow SELECT, FROM, JOIN, GROUP BY or WHERE. The joins between the tables are left to the tool, and the grouping is controlled by a separate extension that sits outside the core of the specification. An expression can also be written in the dialect of a specific tool, such as Snowflake, Databricks or DAX.
The reaction in the group was that this defeats the point. If the standard does not fix how the average is grouped, three tools can still give three answers on the delay. Then we found derived_by in the ontology. There, average departure delay per route is defined like this:
Delay == AVG[Flight.departure_delay WHERE Flight.route(Route) GROUP BY Route]
The definition is precise, and anyone who knows the business can read it. But it is written in relational logic and not in SQL, and we found no converter in the repo that turns derived_by into a query that can be run. The definition describes the number, and a tool still has to calculate it in its own way. Ossie makes the disagreement between the tools visible, but does not remove it.
Snowflake sees the same gap. In the announcement of the Apache name the company writes that it will propose a dedicated expression language, more advanced logic for metrics and a shared query specification that all engines can support.
Does Ossie work with Power BI?
Partly. Microsoft backed Ossie at the end of September, and the converter for Power BI and Fabric turns an Ossie file into a semantic model and back. But measures from Power BI stay in DAX, only a narrow set of SQL expressions are translated, and Chris Webb at Microsoft believes people should define the metrics in Power BI.
For most Norwegian organisations this is the most important question. Microsoft wrote on the Power BI blog that the company backs Ossie, in close collaboration with Snowflake, and according to Snowflake engineers from Microsoft are part of the work. The converter works without connecting to the services. A measure from Power BI becomes a metric with its expression in DAX, and only a narrow set of SQL expressions are translated to DAX. The documentation explains why: DAX calculates aggregates within a filter context that does not exist in SQL.
An expression the converter cannot translate becomes an empty measure with a warning. A guessed formula would be worse, the authors write. A type conversion that disappears, or an aggregate that is spread across a join, gives a model that loads and returns a number, just the wrong number. It is a sensible choice. But it means that a definition in SQL and one in DAX can sit side by side in the same file, without anything in the standard being able to say whether they give the same number.
When we tried the converter for Power BI on our internal day, it seemed immature, and it handled relationships poorly.
Chris Webb is on Microsoft’s customer advisory team for Fabric. In April he wrote that Power BI will not work fully with semantic models from other vendors. A semantic model in Power BI assumes that it is where all the metrics are calculated. If a metric is defined elsewhere, Power BI cannot guarantee correct subtotals and totals. He writes that it is possible and supported to synchronise metrics from another semantic layer into Power BI. His advice is nevertheless to define all the metrics in the semantic model in Power BI.
Microsoft writes that the company will work for DAX to become a language the standard recognises, and for better support for ontologies. A definition from Power BI can then sit in an Ossie file without being translated, but it can still only be calculated by tools that understand DAX. The format becomes shared, while the calculation stays where the definition is written, which matches the advice Webb gave in April.
What the converters move, and what they lose
The converters move datasets and fields between the tools, but metrics only partly. Ossie has nothing that corresponds to all the types of metrics in dbt and Power BI, and whatever has no place in the standard falls away along the way. The table below is based on the converters’ documentation, not on a run against a real model.
Simon Späti, the author of the book Patterns of Data Engineering, wrote in September that a model in the standard can easily be mapped to any semantic layer. That spares us a separate YAML dialect for each tool, as LookML, Cube, dbt and Snowflake have today. For datasets and fields that holds, but for metrics the converters paint a different picture.
| Converter | Direction | What to watch out for |
|---|---|---|
| Power BI and Fabric | Both ways | Measures in DAX stay in DAX, and SQL expressions outside a narrow set become empty measures with a warning. Inactive relationships and many-to-many relationships are not carried over |
| dbt | Both ways | Conversion rates in a funnel and metrics marked as private are not carried over |
| Apache Polaris | Both ways | Only tables, columns and types are carried over |
| Snowflake | Read and write, in preview | What exists only in Snowflake is put in separate extensions |
A migration through the standard loses whatever lies outside the common denominator, and the warnings from the converters are part of the check.
Where Ossie has a job to do today
The clearest use case is overview. Read out all the semantic models in Power BI through the API, turn them into Ossie, with the measures in DAX, and put them in a repo. Then you can see where a concept like active customer is defined across ten or a hundred models, and where the definitions diverge.
The overview gives a basis for clean-up and migration. If you see five variants of the same metric, the business can choose one. The logic can also be moved from Power BI down into the platform, where the agents can use it. At a customer with Databricks and Power BI, where a data agent is to answer alongside the reports, a shared definition in the same repo can make sure the agent and the reports calculate the same way. An agent can also use the mapping to look for overlapping concepts, as long as someone keeps the mapping up to date.
The vendors have started building the road. Snowflake can today read a semantic view and write it out as an Ossie file, and build a semantic view from an Ossie file, for now in preview. Features that exist only in Snowflake are put in separate extensions, so that the definition survives the trip through other tools. The idea is the same as in declarative data platforms: you describe what you want in a file, and the tool does the work.
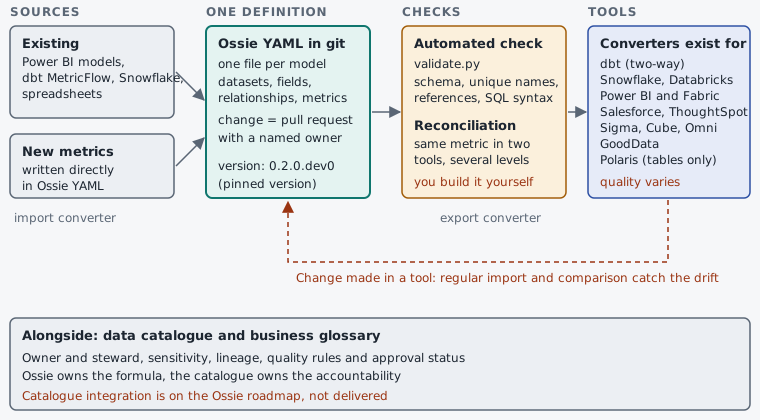
The figure shows how we would introduce the standard at a customer today, in six steps:
- Start with five to ten metrics the departments disagree on, and write down where each is defined and what numbers it gives.
- Import from the tool that is used most, correct by hand and put the files in git.
- Give each file a named owner, and check every change automatically. The Ossie repo has a validation script that checks schema, unique names, references and SQL syntax.
- Export to two tools and calculate the same metric at a few levels of detail.
- Explain or remove the discrepancies before anyone trusts that the numbers are the same.
- Only then link the metrics to the concepts in the data catalogue, and let the agents use the descriptions and synonyms in the model.
The dashed line shows the drift you have to catch when someone changes a metric directly in the tool and bypasses git. The import converters exist, but you have to build the job that compares yourself.
The data catalogue owns what Ossie lacks
Ossie has no fields for owner, steward, domain, classification, lineage or quality rules. The standard describes how a concept is calculated, but not who is accountable for it or how good the data behind it is. That is the job of the data catalogue and the business glossary. We have shown how a catalogue can be built up in the data product guide.
Jochen Christ, co-founder and CTO of Entropy Data, contributes to the ontology working group in Ossie. He places the standard on three levels. At the top is the ontology with the concepts, relationships and rules. In the middle are the data products, the data contracts and the semantic models in the BI tools, which point up to the concepts and down to the tables. At the bottom are the tables and columns. Ossie describes the top two levels, while data products and data contracts have their own open standards from Bitol.
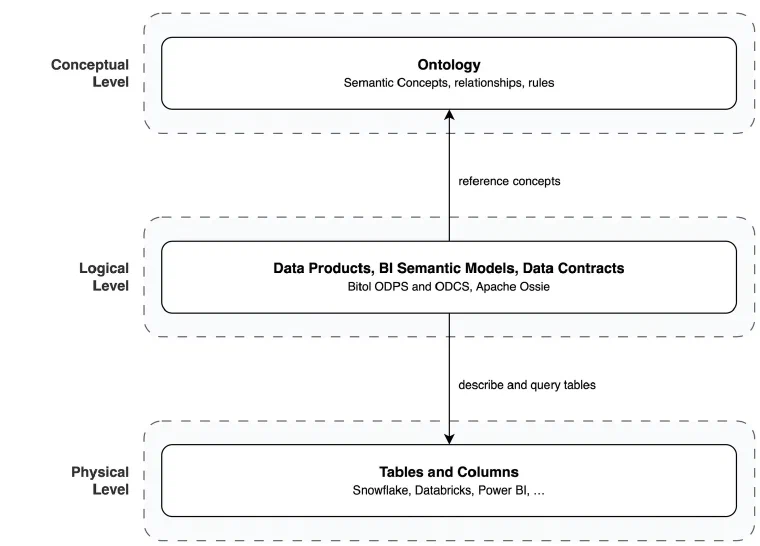
In that model it is the data product that has an owner and delivers the data, and the data contract that describes schema, quality rules and terms of use. Each field in the contract can point to the concept in the ontology it represents. With that division of labour Ossie does not need its own fields for owner and quality, but someone has to keep the link between the contract and the concept up to date.
The overlap is greatest in the business-facing part. An entry in the glossary is a concept with a definition, an owner and a status. A metric in Ossie has a name, a description and synonyms, and in addition an expression that can be run. The division of labour is therefore that the glossary owns the concept and the responsibility, while Ossie owns the calculation. You have to build the link between them yourself today, because integration with the catalogue is on the project’s roadmap and has not been delivered.
The group was also sceptical of the data catalogue as an idea, because few can be bothered to keep it up to date. If Ossie is extended with ownership and stewardship, the standard becomes very broad. We have written about what unclear data ownership costs, and that cost does not shrink because the definitions live in YAML.
The objections that remain
Four objections remained after the internal day, and all of them concern what the standard does not solve: the definition is detached from the data, owner and process are missing, a file format does not structure the business’s knowledge, and the work is young. None of them is a reason not to try the standard, but they decide how much you can trust an Ossie file on its own.
The definition is detached from the data. In dbt a relationship is tested against the data every time the model is built. In Ossie it just says that the relationship holds, and nobody sees whether it is true until someone calculates the number. Data contracts solve the same problem for schema and quality, with expectations that are tested.
Owner and process are missing. Ella Pham wrote in 2024 in the newsletter Data & Beyond that a semantic layer without owners of the metrics defeats its own purpose. Users still argue about what the numbers mean, but can no longer fix them themselves. Silja Märdla describes the same thing from a project with two competing semantic layers. The hardest part was rarely defining the metrics, but getting enough agreement across the teams for the definitions to be trusted and used in several tools.
The business has to structure its knowledge, and a file format does not do that. If an organisation manages that, a markdown file with the concepts and how they relate would be almost as useful as a YAML file. Top-down modelling, where you start with how the business works, rarely happens, and the role of information architect has largely disappeared. A talk at Big Data London this autumn was a reminder that the semantic layer is not new. SAP BusinessObjects had the Universe, and Cognos had its own layer. Simon Späti dates the idea to 1991, when Business Objects patented it. What is new is that the layer is to be used by agents, at a scale nobody can follow up by hand. The talk highlighted data modelling as the key skill, and we agree.
The work is young. At Big Data London, semantic layer and context were the main theme, without a shared understanding of what a semantic layer is. One of the keynote speakers showed a slide with a whole row of competing specifications. In a conversation at one of the stands we heard that people come and go in the work on Ossie, and that few have it as a full-time job. The proposal to Apache itself says that the core developers come from three companies, Snowflake, Dremio and dbt Labs, and calls bringing in more of them a crucial goal of the incubation. At the same time the repo is moving: there were new commits on both 7 and 8 October, and the working groups for the metrics language, the catalogue and the ontology have their own leads.
Another group found it hard to see what problem the standard solves, and felt the specification does not say clearly how two tables are joined, or what cardinality the join has. The answer is there, but it is easy to miss. A relationship in the core of the specification is a foreign key from the many side to the one side, and whether it is many-to-one or one-to-one is decided by the primary key. In the flight example the cardinality is in the ontology, which is a separate format outside the core, while the semantic model has no relationships. Anyone who wants to understand the joins has to read two files in two formats.
Cardinality decides whether the number comes out right. Hao Wu at PuppyGraph, which itself builds export to Ossie, uses a 100-dollar order with three order lines as an example: if the order total is joined to each line and summed, the answer is 300 dollars. That the relationship is in the model does not prove that the tool doing the calculation handles it correctly.
There are two things about joins the specification cannot express. It has no place for the join type, that is, whether rows without a match in the other table should be included or left out, so the tool doing the calculation decides. Nor can it say which join a metric should use when two fields point to the same table, such as order date and delivery date against the same date table. In Power BI the answer is an inactive relationship that the measure switches on when it needs it. The converter for Power BI reports that Ossie has nothing equivalent, and leaves the relationship out.
When Ossie is worth the time
Ossie is worth looking at now if you have many semantic models in Power BI or other BI tools and do not know where the metrics are defined, if logic is to be moved down into the platform, or if an agent and the reports must give the same answers. Then the standard is a good format for the overview, and the converters give a first draft.
The standard is less useful if you have one BI tool and one place where the metrics are defined, if nobody owns the metrics, or if you expect it to make all tools calculate the same way. Nor does it replace the data catalogue.
How long the maturing will take, nobody knows. The proposal uses Apache Polaris, the catalogue for Iceberg tables, as its model for bringing in more contributors. Polaris entered the incubator in August 2024 and became a top-level Apache project in February 2026, a year and a half later. Alex Merced at Dremio, who says himself that he is not neutral, advises reading Ossie as a direction to follow and contribute to, not as a finished format to bet a migration on this quarter.
If the standard catches on, the calculation changes. If the major tools can read and write the same file, the way many engines today read tables in Apache Iceberg, an organisation can switch tools without rebuilding its business logic. It then also pays off more for the vendors to build tools around one shared standard than around the format of one platform.
If you adopt it, lock the version of both the specification and the converters. Run the converter for Power BI with the --strict flag, so that it fails instead of losing something without telling you. Then calculate the same metric in two tools before you trust that they are the same.
The questions we take with us
Ossie cannot tell you which of the three answers on the delay is correct. It can show that there are three definitions, where they live and what separates them. If they are in different languages, such as SQL and DAX, someone has to calculate the number in both tools and compare. The choice belongs to the business, as it always has.
Two questions from the room remained unanswered. Is a star schema with good names a semantic layer in itself, or do metrics have to sit on top? And can agents that answer in natural language become the way out of Power BI for organisations where Copilot does not answer well enough?
Juan Sequeda, who works on data strategy at ServiceNow, has asked two questions about the context layer the agents are to read from, and they apply just as much here: where should it live, and who owns it? All the platforms answer that it should live with them, and if it has no owner, it decays.
If you want to see where your metrics are defined today, the semantic models in Power BI are a good place to start. Send us a message, and we will show you what such a mapping can look like.
Frequently asked questions about Apache Ossie
What is Apache Ossie? Apache Ossie, formerly Open Semantic Interchange, is an open specification for describing semantic models and ontologies in YAML: datasets, fields, relationships, metrics and business concepts. The aim is that the definitions can be moved between BI tools, data platforms and AI agents. The project is in the Apache Incubator, and the specification is a draft.
Does Ossie calculate the metrics? No. Ossie describes where a metric is defined and which language the expression is written in. The tool that uses the model does the calculation, and joins and grouping are largely left to the tool. That is why two tools can give different numbers for the same definition.
Do Power BI and Fabric support Apache Ossie? Yes, in an early form. Microsoft backed the standard in September 2026, and there is a converter that turns an Ossie file into a semantic model for Power BI and Fabric, and back, without connecting to the services. Measures from Power BI are kept in DAX, and only a narrow set of SQL expressions are translated to DAX. Chris Webb at Microsoft has written that Power BI will not work fully with semantic models from other vendors.
Does Ossie replace the data catalogue? No. Ossie has no fields for owner, steward, classification, lineage or quality rules. The data catalogue and the business glossary own the concept and the responsibility, while Ossie owns the calculation. Integration with the catalogue is on the project’s roadmap and has not been delivered.
Can we use Ossie in production today? The specification itself says it should not be used in production, and the format changes between versions. Today it is suited to mapping, clean-up and migration. Lock the version of the specification and the converters, and compare the numbers in two tools before you trust them.
Sources
- Apache Ossie: the repo on GitHub, with the specification, the flight example in the examples folder and the converters in the converters folder, read on 7, 8 and 15 October 2026.
- Apache Incubator: OssieProposal, the incubation proposal, June 2026, and the status page for Polaris.
- Alex Merced: Meet Apache Ossie (incubating): The Open Semantic Interchange Finds Its Home at the ASF, LinkedIn, 2026.
- Snowflake on the project website: Apache Ossie (Incubating): The New Name for Open Semantic Interchange.
- Snowflake: Snowflake, Salesforce, dbt Labs, and More, Revolutionize Data Readiness for AI with Open Semantic Interchange Initiative, 23 September 2025.
- Snowflake documentation: SYSTEM$READ_OSSIE_YAML_FROM_SEMANTIC_VIEW.
- dbt Labs: dbt Labs Affirms Commitment to Open Semantic Interchange by Open Sourcing MetricFlow, 14 October 2025.
- Microsoft: Microsoft & Snowflake’s Commitment to Apache Ossie, Power BI Updates Blog, September 2026.
- Snowflake: Breaking Down Semantic Silos: Microsoft Ecosystem Support Comes to Apache Ossie (Incubating), 30 September 2026.
- Chris Webb: Power BI and support for third-party semantic models, 12 April 2026.
- Simon Späti: Business Intelligence, Semantic Layer, Modern OLAP, Data Virtualization, chapter in Patterns of Data Engineering, updated January 2026.
- Simon Späti: Context, Semantics, and Ontology: A Primer for the Agentic Era, MotherDuck, 2 September 2026.
- Jochen Christ: What is Apache Ossie?, Entropy Data, 22 August 2026. Figure 3 is taken from here.
- Hao Wu: What Is Apache Ossie? How Does It Works?, PuppyGraph, 24 September 2026.
- Juan Sequeda: post on how a context layer should be built, LinkedIn, 2026.
- Ella Pham: #30 - The why, how and what of semantic layer, Data & Beyond, 9 June 2024.
- Silja Märdla: post on semantic layers and metrics, LinkedIn, 2026.