
Contents

Data quality: how good does the data need to be, and who decides?

Category: Data Governance | Tags: #Podcast, #Data Quality, #Data Governance
AI agents trust the data they are given, which makes data quality a precondition for everything else we do with data. Bjarte Tolleshaug and Magne Bakkeli explain why quality is measured against the purpose, where to start, and why most of the work is about people.
Last updated: October 2026. This article is based on a conversation with Bjarte Tolleshaug in episode 19 of the Norwegian podcast Datautforskerne.
In short: How good the data needs to be depends on what it will be used for. Choose the few dimensions that matter for the purpose, prioritise by what the errors cost, start with master and reference data, and make the cost of poor data quality visible. Most of the work is about people and ownership, not tools.

In episode 19 of Datautforskerne (in Norwegian) I talked with Bjarte Tolleshaug, Chief Consultant and Discipline Lead Cloud & Data at Experis Bergen, about why data quality has become the precondition for AI, and how to get started without trying to check everything.
You give an AI agent a task and a dataset, and it solves it. Quickly, confidently, and in language that makes it sound right. The problem is the one Bjarte describes like this: “If you set agents to work on a dataset, they take it for granted that what is there is correct, and they don’t question much of what they find.” A colleague would do the same if you explained the task badly and handed over the wrong numbers. The difference is that the human often hesitates, while the agent answers confidently whether the foundation is good or bad.
This is where data quality has gone from being a somewhat dull discipline in the background to the precondition for everything we try to achieve with data. The root cause when AI solutions miss is usually not the model, but that the data and context underneath it are not good enough. The numbers point the same way: in June 2026 McKinsey found that only 7 per cent of companies have scaled AI across the business, and that more than two thirds of the top performers name data as the biggest obstacle (McKinsey). AI has given data quality the attention it always deserved.
The data must be good enough for a specific purpose
The most useful definition of data quality is also the simplest. DAMA, the international association that promotes good data management, calls it “fit for purpose”. Quality is not measured in a vacuum, but against what the data will be used for. As Bjarte puts it: “The quality of data can be good for one thing, but not for another.”
Take a postal address in the customer register. For historical analysis, an old address may be perfectly fine. To ship a product, it has to be the latest and correct one, and you may want to confirm it with the customer before you send anything. Same field, two very different requirements. When you check the balance on your bank account, you expect the number to be one hundred per cent right. A small error in a large analytical dataset often means nothing. Quality is driven by context, and the context decides how good the data must be.
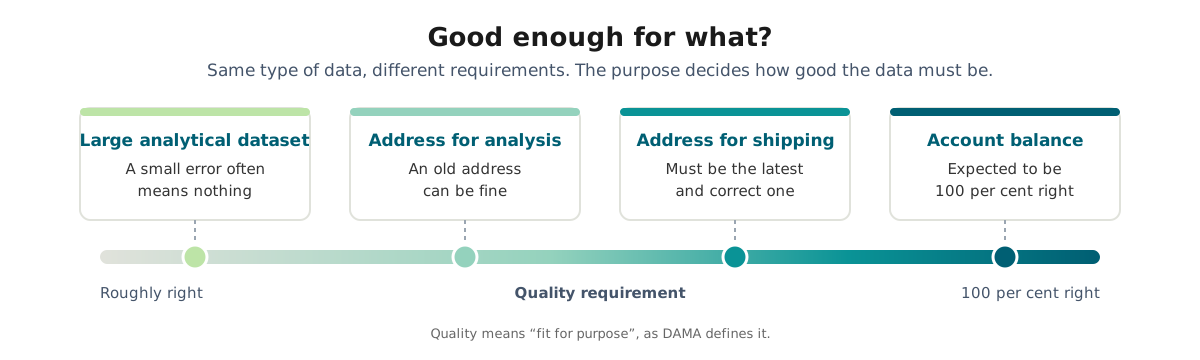
This simple insight is easy to forget when you launch a “data quality project”. Without a purpose to measure against, you end up chasing perfection everywhere, and perfection everywhere is expensive. Very expensive.
Quality is more than whether the number is right
We tend to think of data quality as the question of whether a number is correct. That is only part of the answer. Just as often it is about the concepts and definitions, the semantics: do we mean the same thing by “active customer” across our systems? Data quality is about metadata, about timeliness, and about the data being modelled at the right level. If you aggregate too hard at the point of collection, you lose the information you later needed.
Bjarte uses a classic space example to show how badly things can go when the concepts slip: NASA’s Mars Climate Orbiter was lost in 1999 because the ground software calculated in US customary units while the software on board used metric (NASA). The numbers were correct in themselves. It was their meaning that was wrong.
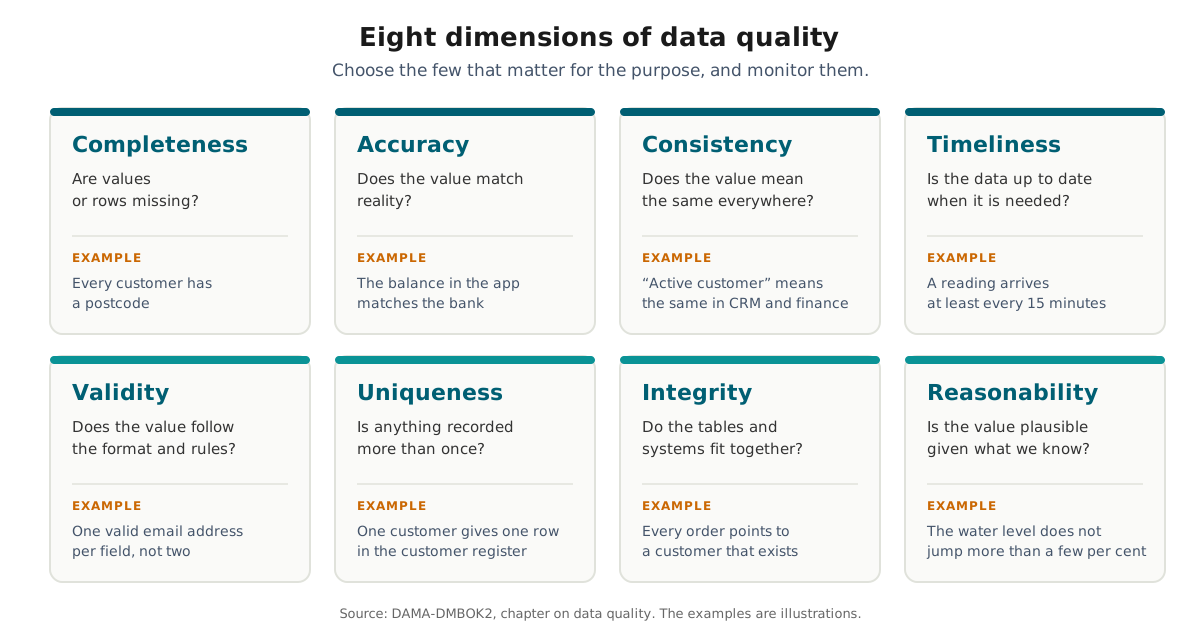
To make quality measurable, Bjarte points to eight dimensions from DMBOK, DAMA’s body of knowledge: completeness, accuracy, consistency, timeliness, validity, uniqueness, integrity and reasonability. You rarely need all eight. The point is to choose the few that matter for the purpose, and to follow them up.
You can’t check everything
With modern tools you can set up quality checks on almost anything. That is exactly why the most important decision is what you will not check. Bjarte has seen what happens otherwise: “If you really want to check everything, you test it to death. Then you spend more time keeping track of your tests than getting value out.”
Prioritisation should be driven by consequence. A wrong number in an analysis is annoying, but you can live with it. An error that makes a control system open a sluice gate it shouldn’t, or feeds a self-driving car the wrong data, is a different matter altogether. For one of Glitni’s customers in the energy sector, a simple water-level sensor is where good or poor data quality begins. The sensor is “dumb”, and if its readings flatten out, something may be wrong. If nobody notices, the error propagates upwards into production forecasts and bids to the grid, where a lot of value is at stake. The countermeasure itself is cheap: simple routines, people who know the plant, perhaps a camera. What is expensive is not knowing.
The natural starting point is master and reference data: customer, product, supplier, organisation, lookup lists and hierarchies. These are the central sources many systems depend on, and they give the most return for the effort. If you are in a regulated industry such as banking, energy or healthcare, the reporting requirements are an obvious place to begin. One good test of what is worth securing: what happens if you lose this data, and could you recreate it? Start small and expand step by step. Checks for completeness, timeliness, uniqueness and validity are cheap to set up and a good place to start.
Calculate what poor data quality costs
The quickest way to get a hearing for data quality is to make the cost concrete. Bjarte uses a worked example from marketing: an organisation sends out 16,000 messages, but loses 3,000 of them every time because of errors in the data. If you know each new customer is worth NOK 1,800, the loss is suddenly easy to put a number on.
Invoicing is another example. If you send invoices with errors, they are disputed, and payment that should have arrived in 30 days slips to 90. On top of that comes the manual follow-up, a hidden payroll cost. Once you can put a monetary value on poor data quality, the work on data quality gets the attention it needs. Without a number, it remains a technical detail nobody prioritises.
Cost is only one side of the equation. In Modern Data 101, Sebastian Wernicke points to the other: all the usual dimensions are measured at the moment the data is produced, and none of them tells you whether the data changed a decision. His first, rough measure is a single question: how often does someone look at the data before a decision and change their mind? In many organisations the honest answer is “rarely”, and that alone should change what you prioritise.
It’s about people, not technology
The technology for measuring and improving data quality has existed for a long time. The bottleneck is almost always something else: the people who create and use the data are not aware that it will be created and used somewhere else. My estimate in the conversation was that seventy to eighty per cent of the problem lies there, and Bjarte agreed. The job is to get the right people in the same room and create ownership and accountability. Bjarte has picked up an expression he likes a lot: “It’s about helping someone get it right the first time.”
This is where the roles come in. In DAMA’s terms, a data owner is the person who makes the decisions about a set of data, typically a business leader with the most to lose if the data is wrong. A data steward does the operational work and can be both a technical and a subject-matter expert. In practice these are often five-per-cent roles rather than separate positions, which makes it all the more important that responsibility is clearly placed. If you escalate the decisions too far up the leadership to gain clout, you also lose the core knowledge held by the people who understand what the data means.
To scale this in a larger organisation, most end up with a federated model: shared standards at the centre, local ownership in the domains. It is the same insight we at Glitni see again and again in Norwegian organisations. Central governance on the principles, local accountability for the data. A good first step, whatever your size, is to divide the data landscape into domains with a shared vocabulary and draw a map of them. Then you have something to place ownership on, and something to point to when you discuss it.
When people and purpose are in place, the tools follow
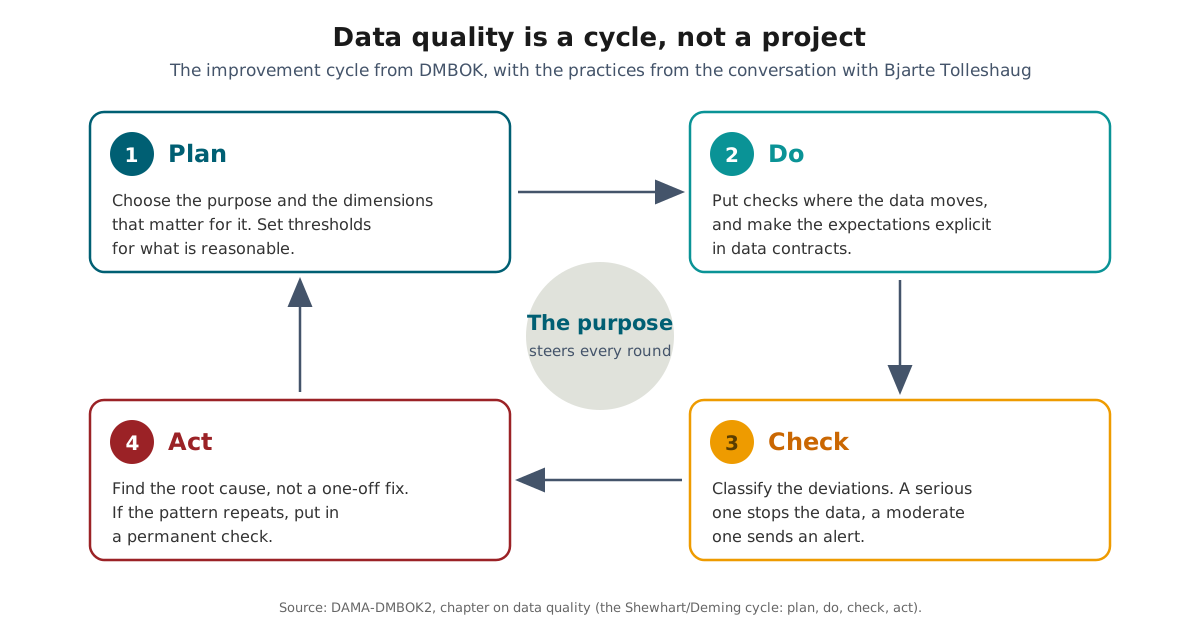
There is plenty to choose from. Data contracts make the expectations between producer and consumer explicit, so that a change to a source field doesn’t simply make the report further down fail silently. In the pipeline you can add checks every time data moves, with reference ranges for what is reasonable. For the water-level sensor, that could be a requirement that a reading arrives at least every fifteen minutes, and that the value doesn’t jump more than a few per cent.
Deviations should be classified, not treated alike. A serious deviation can stop the data from propagating further, while a moderate one sends an alert instead. And once something has gone wrong, the point is to find the root cause and prevent it from happening again, not to apply a one-off fix. The correction belongs where the data is created. “It’s always recommended to fix it at the source, even though the world isn’t always that simple,” says Bjarte. If you see the same pattern several times, that is where you put in a permanent check. All of this ties in with lineage, the traceability that lets you see where in the chain it broke.
DMBOK describes this improvement work as a cycle of four steps: plan, do, check and act, known as the PDCA cycle. The work is never finished, because good quality today erodes as systems change and new data comes in. Every round starts with the purpose, and every permanent check makes the next round cheaper.
Finally, there is trust. An audiobook Bjarte recommends, “The Speed of Trust” by Stephen M.R. Covey, makes a simple point that fits data well: the more trust, the higher the speed. If you share a high-quality data product with a quality indicator the consumer can see, the recipient doesn’t have to check everything again. “When you share something with someone and they keep checking it, it takes ages. And time is money,” says Bjarte. Good data quality is therefore not just risk reduction, it is speed.
When the data is used by an AI agent
A person who sees a strange number stops and asks. An AI agent rarely does, so the quality signal has to be something a machine can read, not just something people know. Robert Sahlin describes how the data platform team at Nordnet has done this: every dashboard shows a health badge in green, yellow or red, calculated from the tests and anomalies in all the upstream tables. The same status is designed to be read by machines. An agent about to write a SQL query can first check whether the tables have active anomalies and warn the user, and a model that is retrained every night can abort and keep the previous version when the training data is on red.
The tests also get a new role. Ido Bronstein, who leads Upriver, a company that sells data engineering automation, let a language model work unsupervised on real data engineering tasks for two weeks. His conclusion is that an agent can only safely be given the job where there is an executable definition of what is correct, and that data quality tests have therefore become what the whole system rests on (Upriver). It is the same question as before: whoever has written down what is good enough can also let a machine do more of the work. We have written more about what separates analytics-ready and AI-ready data products, and about three ways AI lies to you in data engineering.
Where to start
If you are a data engineer and spot a quality problem, it is tempting to set up a technical check straight away. The better first step is to talk to whoever owns the expectations for the use case: what does this data mean, and what is good enough? Bjarte often opens such conversations with subject-matter experts like this: “I know extremely little about what you know a great deal about, but I can see the common thread in what the challenges are.” Define the problem together with the people who understand the root cause, and design the solution afterwards. Sometimes the answer is simple, such as switching from email address to mobile number as the identifier to get more unique keys on the customer side.
The thread running through the whole conversation is that data quality is not a technology task you can buy your way out of. It is an exercise in prioritisation anchored in purpose, and a cultural change anchored in people. Start with what matters most, make the cost of poor data quality visible, and get the right people talking to each other. The rest is mechanics.
Three questions before you set up your next quality check
- What purpose should the data be good enough for? If you can’t answer, you don’t know what to measure either.
- What does it cost if the data is wrong? If the answer is little, a simple check will do, or none at all.
- Who owns the expectations? If nobody in the business has said what is good enough, they are the people you should talk to first.
Frequently asked questions about data quality
What is data quality? Data quality means that the data is fit for the purpose it will be used for, what DAMA calls “fit for purpose”. The same postal address can be good enough for historical analysis and not good enough for shipping a product. Quality is therefore always measured against the use, not as one number for the whole organisation.
Which dimensions measure data quality? DAMA’s body of knowledge, DMBOK, describes eight common dimensions: completeness, accuracy, consistency, timeliness, validity, uniqueness, integrity and reasonability. Few organisations need all eight. Choose the dimensions that matter for the purpose, set reference values for what is reasonable, and monitor them wherever the data moves.
Where should we start with data quality? Start with master and reference data such as customer, product and supplier, because many systems depend on them. In regulated industries such as banking, energy and healthcare, the reporting requirements are an obvious starting point. Prioritise by consequence: what does it cost if this data is wrong, and could you recreate it?
How do we calculate the cost of poor data quality? Put a monetary value on the errors. If you send 16,000 messages and lose 3,000 of them because of errors in the data, and each new customer is worth NOK 1,800, the loss is easy to work out. Errors on invoices lead to disputed claims, payment slipping from 30 to 90 days, and manual rework.
Who is responsible for data quality? The data owner makes the decisions about a set of data and is typically a business leader with the most to lose if it is wrong. The data steward does the operational work. In larger organisations most end up with a federated model, with shared standards at the centre and local ownership in the domains.
Listen to the full conversation with Bjarte Tolleshaug
Listen to the Norwegian podcast “Datautforskerne”, episode 19, where Bjarte Tolleshaug and Magne Bakkeli talk about data quality in the age of AI. The episode is available on Spotify, Apple and Acast. In episode 16 we talked about how organisations create value from data.
Cover photo: Blåsjø towards the Førrevass dam in Ulla-Førre, Norway. Dams like this one have water-level sensors, and the readings inform operational and commercial decisions about power production. Photo: Martin NH via Wikimedia Commons, licence CC BY-SA 3.0.
