
Contents

How to create value from data: four phases, four pitfalls

Category: Data Strategy | Tags: #Podcast, #Data Strategy, #Data Team
Data initiatives create value when the organisation matures, not when you buy a platform. Ali Ahmad and Magne Bakkeli describe a journey in four phases, from the first marketing channel to CAC, LTV and a shared language across silos.
Last updated: September 2026. This article is based on a conversation with Ali Ahmad in episode 16 of the Norwegian podcast Datautforskerne.
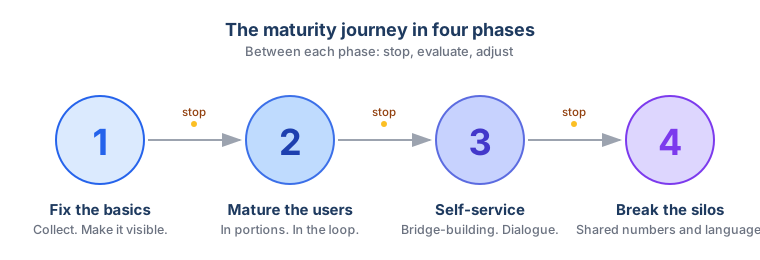
In short: Data creates value when the organisation learns to act on it, not when the platform has been bought. The journey has four phases: bring the most important sources together in one place, mature the users through gradual delivery, open up for self-service through dialogue, and break down the silos with shared definitions. Between each phase you stop, evaluate and adjust.

In episode 16 of Datautforskerne I talked with Ali Ahmad, consultant and founder of Analysehuset with ten years in the industry, about how organisations get value from data. He has led data and analytics at Egmont, Sector Alarm and Try, runs a YouTube channel about Power BI and the Microsoft stack, and has a good sense of when an organisation is ready for what.
Data doesn’t create value. Action does
Many organisations have plenty of data integration and data transformation, but little business value to show for it. The reason is nearly always the same: we start in the wrong place. We bring in data, buy a tool and set up a dashboard before we have worked out what we actually want to learn, which decisions the data should inform, and how the organisation should work differently once the insight is there.
Sebastian Hewing puts it simply: “Data doesn’t create value. Action does.” It is the simplest sentence I know for describing what many data initiatives forget.
What we arrived at is an organisational maturity journey in four phases, with four pitfalls that are all too easy to fall into. Here it is.
Start with the north star, not the tool
A classic scenario: Anne in the marketing department comes along and says “we think there is a lot to gain from understanding XYZ better”. The standard response in many data teams is to start pulling data from a whole range of source systems.
The right response is a counter-question: What do you actually want to get? How are you planning to use the data? What happens if we have this in place in three months rather than in two days?
Outcomes before tools. That does not mean you need every answer up front. The value journey goes back and forth, and what we thought at the start is rarely where we end up. But you need to know what the north star is.
Three questions I use often work just as well on internal stakeholders as on paying customers:
- What is stopping you from reaching your goal today?
- What are you doing now to solve it?
- What would it mean for you if this were solved?
If Anne struggles to answer those three concretely, the data initiative is not mature enough yet. Then you should not start building data integrations and transformations. Keep asking, until the north star is clear enough to build towards.
Phase 1: Fix the basics
Before you run A/B tests, media mix modelling or attribution models: bring in the most important sources and make them visible in one place.
For Anne, that could mean pulling data from every marketing channel against a single campaign: Snapchat, Facebook, Google, TikTok, paid search. For a sales director, it could mean seeing the pipeline across districts and product lines. For a finance director, it could mean a monthly P&L based on preliminary operational data, not just the accounting system.
The value is not in the analysis. The value comes from someone spotting a deviation before it is too late. A marketing manager who sees on Monday that the campaign is losing momentum can cut the budget on Tuesday. A controller who notices in May that the margin is slipping has time to act before the quarter closes. As Ali puts it: “A lot of valuable things happen for those who have control of this and can turn around fast enough to adjust.”
This is where the first pitfall lies in wait: we bring in too much data. Ali admits it himself: “I’ve got it wrong before. I’ve brought in data and thought something magical would happen with it. It didn’t.” The data contains, for example, free-text fields where there should have been categories, half of the purchases are missing tags, and there is no way to do category management. The result is disappointed stakeholders and lost trust.
Check the data before you bring it in. Talk to the owners of the sources. Use the quality problems as the start of a conversation, not as a dead end.
Phase 2: Mature the users through gradual delivery
Ali warns against the phase where the sweet shop opens and you pick out too much. “Make sure what we offer doesn’t explode the first time. That we manage to hand it out in portions, and see that now we’re here, now we’re a bit further along.”
The maturity journey needs stops along the way. What worked? What should we stop doing? What should we develop further? These stops matter just as much as the deliveries between them.
This is also where the user’s needs must be sacred. You are not delivering for yourself. You are delivering for the controller who opens Excel at seven every morning. For the warehouse manager with 14 meetings in the calendar. For Anne, who has a marketing budget of seven million kroner and must decide the channel mix by Friday.
The classic contrast, what Ali calls “the old model”, is the IT department that built reports on behalf of the users. The users described what the world looked like. IT modelled it. The users got a finished report back. “That’s fine, that’s what we said, yes. Bye, Margrethe. See you in two years. Or maybe never.”
That is project delivery, not maturity. Maturity requires keeping the user in the loop between every iteration, not just at kick-off and handover.
Phase 3: Self-service through bridge-building
Adoption does not come from training courses. It comes from dialogue. Start simple: a summary email to a department head, a rock-solid dashboard with just three key figures, a PowerPoint where you explain what the numbers mean. Build the bridge with the people who will carry this forward in their daily work. Let them ask the questions that shape the next iteration.
When Anne sees that the numbers match her reality, she can gradually open up for her own marketing analysts to build things themselves. When the controller gets a model he can pull straight into Excel, he no longer has to do the monthly copy-and-paste exercise and starts spending the time on analysis instead. That is when the ball starts rolling.
One point that is often underestimated: upstream data quality improves as a by-product of self-service, not of data quality projects. When salespeople see their own numbers alongside everyone else’s, it suddenly becomes obvious why the CRM field should be a drop-down and not free text. Then it gets filled in correctly without anyone nagging. “You understand what it’s used for, and then you automatically fix the quality.”
Bridge-building is not without risk either. When you go from one dashboard to “here’s the data, go play”, you open the door for people to interpret and define things their own way. A perfect single source of truth is a myth. Sales and finance can have legitimately different definitions of revenue. A realistic goal is not one monolithic truth, but documented definitions with an owner per definition. That takes us straight into phase 4.
Phase 4: Break the silos
This is the phase Ali thinks is most underestimated. When marketing, sales, finance and operations get shared numbers to discuss, something new emerges: organic networks and sharing sessions across departments. “This is how we do it. That worked. That didn’t.” Once a month, every third week, whatever the rhythm turns out to be.
This is where data stops being a report delivery and becomes a catalyst for process change. You discover that two departments own the same KPI with two definitions. That one meeting can be dropped because another department is already analysing the same topic. That category management and purchasing need to coordinate, because otherwise they solve the same problem in three different ways.
Yuki Kakegawa, Staff Data Engineer and founder of Orem Data, has been the only data person in an organisation. In an interview with Yordan Ivanov on Data Gibberish in April 2026, Kakegawa describes what is broken almost every time in young companies. It is rarely the tools, but “the alignment on what’s important, the definition of metrics, what we want to build.” Most organisations have three departments with three definitions of the same number. Pick one department’s definition and you put another in a bad spot. Try to reconcile them and you are suddenly in a political conversation nobody hired you to have. Kakegawa says it plainly: “That’s the part I hated the most.”
That is the job phase 4 is about. Getting Anne, Paul and Oliver to agree on what a customer is, what revenue is, what an active pipeline is. Not by dictating from a governance document, but by letting shared data force the conversation. Once you have that conversation, you have strictly speaking already started creating value. A conversation across silos is rarely free.
When the value becomes concrete: CAC, LTV and the margin ladder
The abstract vision of phase 4 only gets flesh and blood once you have been through the whole course. Ali shares a concrete case from a sales-heavy organisation where the journey took four years.
Years 1–2: They introduced tools that gave them entirely new data on sales activity. The data went into a fixed meeting for managers at a particular level. A lot of time was spent on it. By the end of year two the process was in place. Then they could say quite specifically which salespeople needed coaching on which stages of the sale. Was it booking the meeting? Was it the meeting itself? Was it closing? The coaching became fully targeted, not generic.
Years 3–4: By then it was so well established that they no longer had to talk to the salesperson about “will you log this”. It simply got logged. Then they could go a step further and look at what happens in the moment of sale. Which combinations of offer, discount and contract length give which margin? If the customer gets a 20 % discount with these components, it takes three years before she becomes profitable. With 15 % and a different mix, it takes two years.
Only then did CAC (what it costs to acquire a customer) and LTV (what the customer is worth over the whole relationship) start to make real sense. “How much money do we spend getting a customer? How long do we need to keep her for it to pay off? Is that reasonable? No? Then we need to do something smarter.” At that point they no longer talked to the salespeople about data. Data was simply part of the job, like the phone and email.
That is where the maturity journey ends. Not when the data is good, but when the conversation about the data has disappeared. People act. Margin movements become visible. Decisions get better without extra meetings.
Four common pitfalls
- No leader with skin in the game. Ali himself calls it “the silly word”: executive buy-in. But the point stands: if a leader does not see that this can change something in her own department, there is no point. Use phase 1 to find champions, not to integrate everything. If the boss is not fired up, spend your energy winning people over before you build.
- Collecting too much, checking too little. The classic pitfall. Ali admits it openly: “We didn’t have data quality on this. We had free text on things we couldn’t categorise.” The result was disappointed stakeholders. Check the quality before you integrate.
- Forgetting the user story. We build for ourselves and our own assumptions, not for the people who will use it every day. Ali points out that decentralisation, where users build things themselves, has helped somewhat. But the moment they start building for others, the user is forgotten again. “How often was it again? It was every day, yes.”
- Staying too long in the Power BI phase (or in other reporting tools). Just as dangerous as moving to a platform too early. When something becomes business-critical, a solution that only lives in Power BI stops working. “It’s a badly kept secret. But it’s going to stop working.” Then data engineering has to come in. Not too late, not too early.
A bonus round Ali mentions in passing: building logic too centrally, too early. It is tempting to define everything in a semantic layer or a centralised model before you know how the business will use the data. Wait until you have real traffic through the model before you lock it down.
Internal push marketing
This is Ali’s clearest point, and it is where many data teams lose.
The data team has to get the word out about what it delivers: “This is what we’ve worked on this month. These reports are new. This data is now available.” The rhythm Ali uses himself is concrete: two-week sprints, with a summary email sent widely across the organisation towards the end of each sprint.
The content is not a list of release notes. It is an invitation to use: if you work with campaigns, you can now see the difference between a video campaign and an image campaign aimed at the same audience. If you handle pipeline reporting, there is now a new dimension for product category. If you are a controller, a monthly P&L table is now available.
Without it, usage flattens out. “It doesn’t go down, but it flattens out.” Change management is the bottleneck. Someone has to take responsibility for pushing the ball until it rolls on its own.
When the platform needs to come in, and when it doesn’t
Ali shares a concrete case. A company at a stage of maturity where it was about to start using marketing analytics. It pulled data from a few marketing channels and wanted to connect them to ticket sales. As a technologist, Ali was tempted to propose a data platform.
But where they were, it was too early. Power BI held up as the hub. It removed manual consolidation, brought three business areas together in one place, and established a shared language about what a campaign is. The platform decision could come later.
His reasoning applies broadly: a platform is an investment in future speed, not in today’s insight. If you do not know where you are going, it is too early. If you do not know what is business-critical, it is too early. Power BI gives you time to learn.
But: do not stay there too long. When something becomes business-critical, when it has consequences if it does not work or is out of date, data engineering has to come in. With structure, versioning, tests and governance. Ali sums it up in one line: “Now the technologists get to rub their hands a little and see how they can lift this.”
Three questions before you build the next dashboard
Value from data is an organisational journey in four phases, not a technology project:
- Collect the basics against a defined outcome
- Mature the users through bridge-building and delivery in portions
- Enable self-service through dialogue, not training courses
- Break the silos. Let shared data force shared processes.
Between each phase: stop, evaluate, adjust. Keep communicating what you deliver. Keep leaders on board. And bring in data engineers when you need them. Not before.
Three questions to ask yourself the next time someone asks for a new dashboard:
- Which decision should this dashboard inform? If you cannot answer, it is too early to build.
- Who gets their job done more precisely once this is in place? If you cannot name a role, there is no real value.
- What do we stop doing once this works? If the answer is “nothing”, it is just another layer on top.
When you have answers to all three, you have started creating value. Not before.
Listen to episode 16 of the podcast “Datautforskerne” (in Norwegian), where Ali Ahmad and Magne Bakkeli talk about how organisations get value from data. The episode is available on Spotify, Apple and Acast.